How I Build Dashboards Now with Claude Code
After 10 years of building reporting and dashboards at various companies, I’ve seen the same pattern repeat. A data team spins up Metabase or a similar tool. There’s initial excitement. Everyone talks about self-service analytics. Six months later, the data team is still building custom reports anyway, the models need constant maintenance, and most stakeholders never used the self-service features.
People say they want self-service, but they generally don’t. They want answers to their specific questions without learning a new tool or understanding data models.
For smaller companies, I’ve switched approaches. Instead of setting up self-service infrastructure, I use Claude Code to work directly with stakeholders and build exactly what they need. The development loop is short enough that custom dashboards become practical. And unlike self-service platforms, these dashboards get used.
The Translation Problem
Custom reporting has always had a translation problem. A stakeholder has an idea of what report they want. They can describe the metrics, explain the business logic, walk through how they currently gather this data manually. But they don’t know what tables exist in the database, how entities relate to each other, or how to express their requirements in SQL.
A data engineer understands the schema but doesn’t have the domain context. They need to translate business requirements into queries, and things get lost. The report comes back wrong. There’s back and forth. Eventually it’s close enough and everyone moves on.
Claude Code can hold both contexts simultaneously. It understands business requirements from a conversation with the stakeholder. It can also inspect the database schema, understand table relationships, and write SQL. You spend less time translating because the same tool handles both sides.
Schema Discovery on Its Own
Before building any dashboard, you often need to understand what data you’re working with. Claude Code can write Python code to connect to your database, list all tables, pull schema information, and run sample queries - all without you writing a single line yourself.
Many businesses have undocumented databases. Nobody wrote down what the tables mean or how they relate to each other. The person who designed the schema left years ago. New team members learn the structure through trial and error.
Give Claude Code your database credentials and tell it to explore. It writes the connection code, queries the information schema, samples data from key tables, and produces documentation that didn’t exist before - a plain-language summary of what each table contains and how entities connect. Someone without database access or SQL knowledge can finally understand what data exists. This exploration step alone is valuable, even if you never build a dashboard.
Getting the Requirements Right
You need to capture what the stakeholder actually wants in a form Claude Code can use. Recording and transcribing a requirements conversation has worked well for me.
I’ll have a call with the business partner and ask them to walk through how they currently gather this data. If it’s an existing report they’re trying to automate, I ask them to show me step by step how they assemble it today. If they’re tracking something in an application, I ask them to click through the workflow and talk through what they’re looking at.
This captures the domain language they use - the specific terms for entities, statuses, metrics. That language often maps directly to column names and values in the database. The transcription becomes input for Claude Code - what they want, in their words.
Two types of interviews I keep coming back to:
-
Existing report automation: “Walk me through how you build this report today. Where does each number come from? What do you check or validate along the way?”
-
Metric tracking: “Click through the application and show me what you’re trying to measure. Talk through what you’re looking at as you go.”
You’re capturing their workflow and vocabulary, not producing a formal requirements document.
When You Don’t Know What You Want Yet
Sometimes you don’t start with clear requirements. The stakeholder has a hunch - maybe they want to understand customer behavior, or they suspect something is off with order patterns - but they can’t say exactly what report they need. They want to explore first.
Claude Code works as a thought partner here. It has database access and can write code to process the data. You describe your hypothesis, and it writes pandas code to slice the data different ways, generates summary statistics, identifies outliers. You look at the output together, refine the hypothesis, and iterate.
The exploration often reveals the actual requirements. The stakeholder sees a distribution they didn’t expect, or a trend that raises questions. Now they know what they want to track. Then you move into the structured workflow.
Connecting to Databases: Code vs MCP
There are a few options for connecting AI coding tools to databases. One approach is MCP - many databases have MCP servers that let you query them directly. I’ve tried this, and the problem is that MCP connections often consume too many tokens and pollute your context window.
Having Claude Code write Python and pandas code works better. You tell it about the database and give it credentials. It writes the connection code, runs queries to inspect tables and schemas, loads data into pandas for analysis. The code is straightforward - connection strings, basic SQL queries, pandas operations. For complex queries, it succeeds on the first try more often than it fails.
This keeps context focused. Instead of the entire database schema living in context, Claude Code queries for what it needs when it needs it. I wrote more about code-as-tools vs other approaches in a previous post.
The Workflow
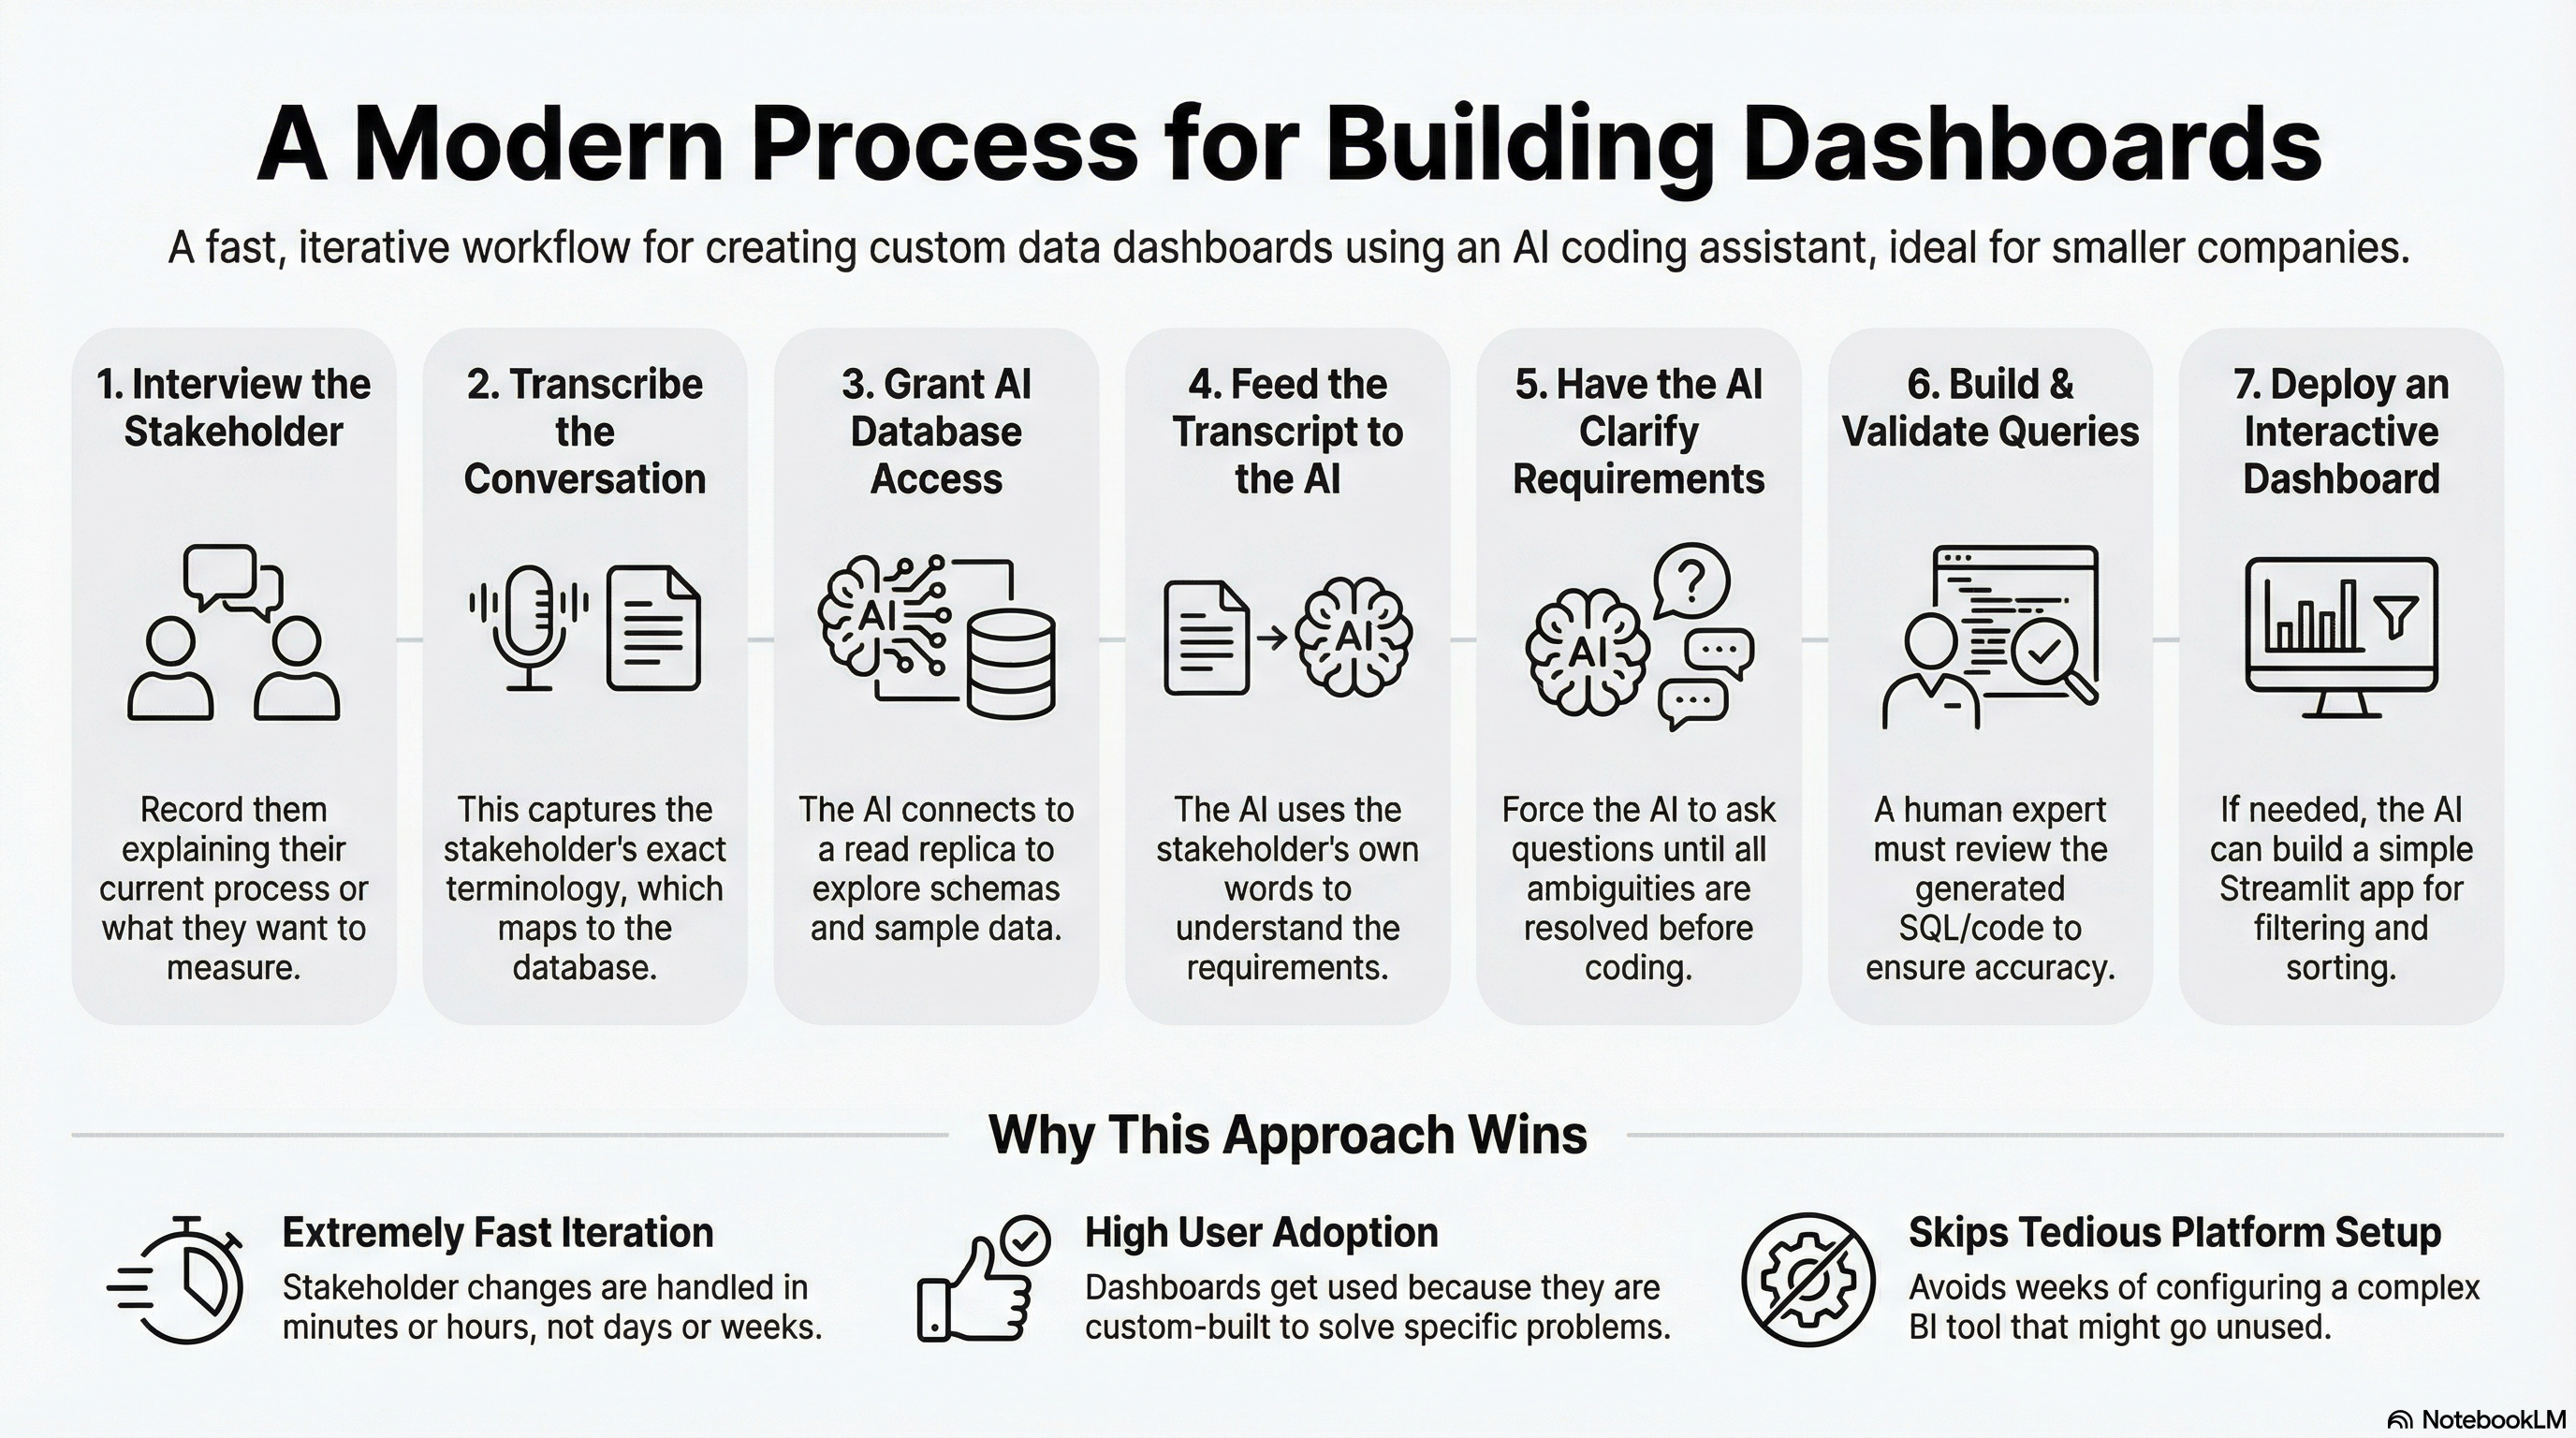
The process I’ve been using:
-
Interview the stakeholder. Have them walk through their current process or click through the application while describing what they’re trying to measure. Record the conversation.
-
Transcribe the recording. I use Apple Voice Memos - just set it on the desk and record the conversation. The built-in transcription works well enough. Other options like Fireflies or Granola work too. It doesn’t need to be perfect - you want their terminology and workflow description.
-
Give Claude Code database access. This is straightforward. Tell Claude Code the database type and credentials, and it writes the Python code to connect and start exploring. It can query the schema, sample data from tables, and start understanding what exists. Working against a read replica or data warehouse is safer than production.
-
Feed the transcript to Claude Code. Describe what you’re trying to build and include the transcribed conversation. I often record myself talking through the requirements in more detail - what metrics matter, what edge cases to handle. The stakeholder’s terminology helps map their request to actual tables and columns. I usually put Claude Code in plan mode first and have it draft an approach before writing code.
-
Have Claude Code clarify until confident. Tell it to use the AskUserQuestion tool until it’s 100% certain it understands what you’re trying to build. Ambiguities come out before you’ve written code.
-
Build and validate the queries. You have options here. Claude Code can write pure SQL, or if you’re comfortable reading pandas code, it can do more rigorous analysis with dataframes. Either way, you validate the results - this requires someone who knows what good looks like, checking sample outputs against expected values. This workflow accelerates building dashboards with technical knowledge, not replacing it. Be cautious if you can’t validate the outputs yourself.
-
Build a Streamlit dashboard if needed. If the stakeholder needs an interactive view - filtering, sorting, drilling into details - Claude Code can build a Streamlit application. These come together quickly. Streamlit is just a Python application, so you have plenty of deployment options - I usually use Modal but any Python hosting works.
I’ve done this in a few hours for focused dashboards. Compare that to weeks of setup for a self-service platform that might never get adopted.
Iteration Is Where You Win
Once stakeholders see the dashboard, they want changes. “Can we also see it by region?” “What if we filter out cancelled orders?” “Can you add a column for the percentage change?”
With traditional BI tools, each change is a ticket in a queue. Someone has to understand the request, update the queries in the tool, test it, deploy it. Days or weeks pass.
With Claude Code, the iteration speed is much faster. You describe what you want, it updates the code, you validate the output. The stakeholder gets their answer while the context is still fresh.
There’s a compounding effect here. If you’re tracking changes in a work log, or using git with clear commit messages, Claude Code can look at the diffs over time. Previous iterations become input to current changes. It understands the evolution of the dashboard and makes more coherent updates. This kind of historical context is hard to get in BI tools like Metabase - you can’t easily see what changed and why, and use that as feedback for your next modification.
When This Works and When It Doesn’t
Small-to-medium businesses with targeted reporting needs. A handful of stakeholders who need specific views into data. The data lives in a relational database that’s reasonably clean. Someone technical can validate the SQL and business logic. That’s where this fits.
That last point is critical. Claude Code can write SQL that looks correct but has subtle bugs - wrong join types, missing WHERE clauses, aggregations that double-count. The stakeholder sees plausible numbers and assumes they’re right. You need someone who can read the queries, spot the mistakes, and validate outputs against known values.
That said, the SQL quality has improved noticeably in the last few months. I’m correcting fewer bugs than I was earlier. The biggest factor is clarity - the more precisely you describe what you want, the better the output. Vague requirements produce vague queries.
My larger view on AI coding tools: they amplify experienced people. If you understand SQL, data modeling, and what good code looks like, these tools make you dramatically faster. You catch errors through code review and testing - the same skills you’ve always used. If you’re newer to this, the tools are still useful for learning, but build in extra validation steps.
This approach is harder to implement in larger organizations where data is fragmented across teams. When you have dozens of groups with different analytics needs, you need centralized metric definitions, a true data warehousing approach, and semantic modeling layers. This pattern isn’t for everyone - you have to be aware of your context to decide if it makes sense.
I covered more caveats in a previous post about building dashboards with AI - the concerns about querying production, data quality validation, and recreating shadow IT still apply.
But for smaller companies with clean data and specific reporting needs, you skip the platform setup. You skip training users on a new tool. You build exactly what they need and iterate when requirements change.
The Underlying Shift
The traditional analytics stack assumed that building custom reports was expensive, so you invested in self-service to let people help themselves. That assumption is outdated.
There are many businesses sitting on a relational database, needing specific views into their data, where off-the-shelf tools haven’t fit. Custom software for this used to be expensive. It isn’t anymore.
This is one pattern that’s working for me. If you’re building analytics differently and getting similar results, I’d like to hear about it.