Five Lessons from Putting AI Into Research Teams
Last month I gave a talk to a private working group of finance professionals, a couple dozen people on the call from a mix of firms. The topic was using AI in investment research. I based the talk on tools I’ve built and conversations with teams across the industry. Thirteen lessons prepared for an hour, questions running throughout, and we got through seven.
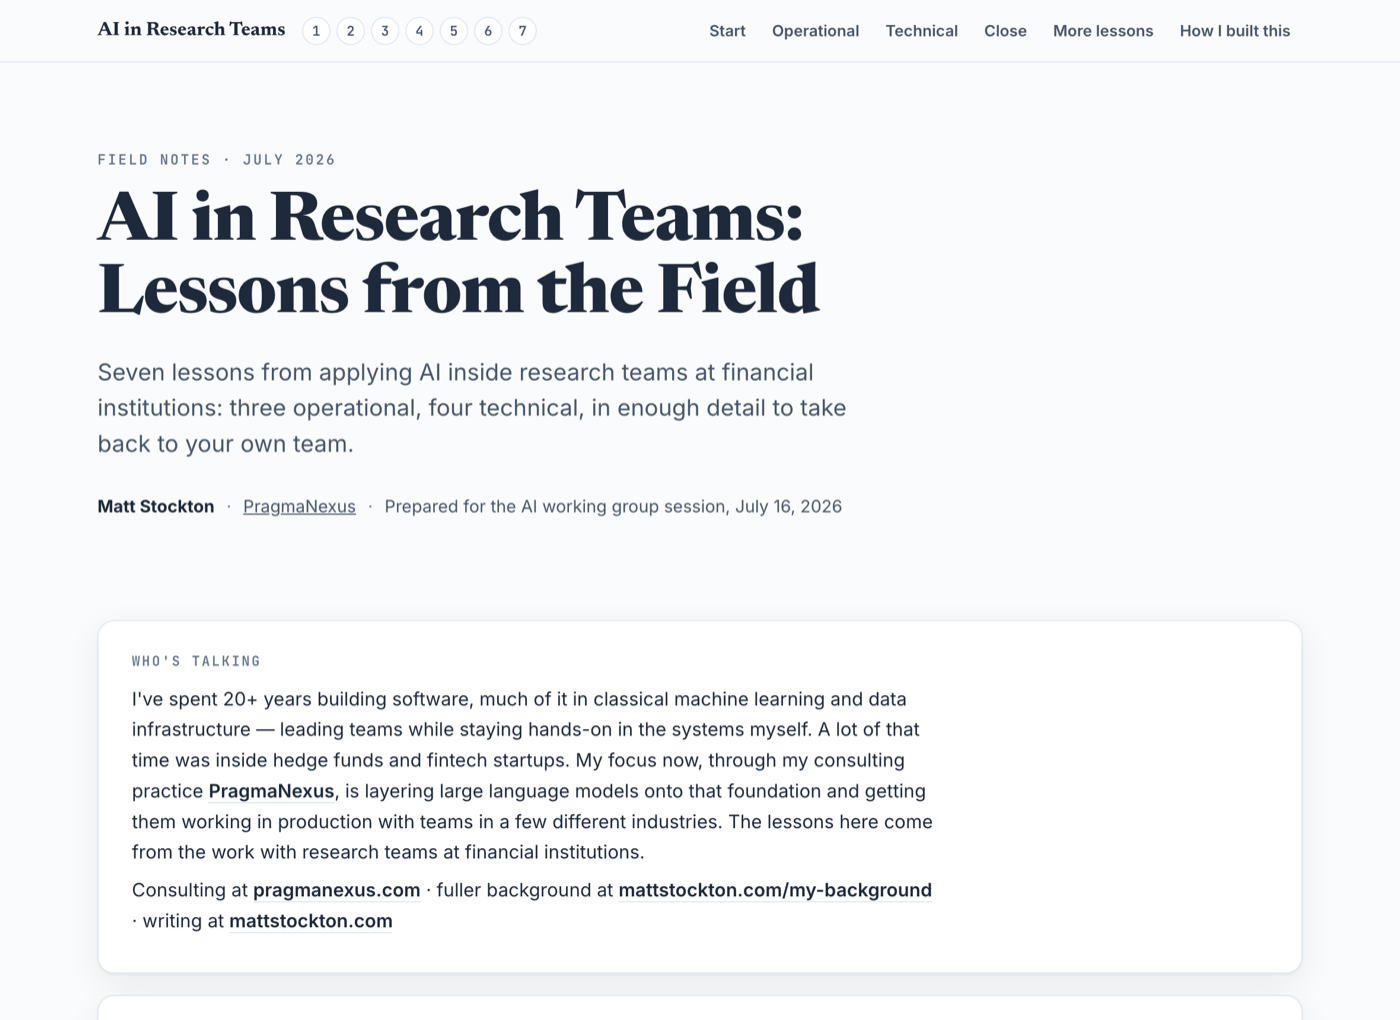
I built the talk as a single interactive page instead of a slide deck, with a figure you can click through for each lesson. It’s still up, and it’s the fuller version of everything below.
These five are the ones I’d keep if I had twenty minutes instead of an hour. They all sit in the same gap: a tool can work and still not get used. That’s where I’ve seen this work stall, and it’s where most of the questions in the room went.
Tools that add work don’t get used
It’s simple math. The time a tool saves has to beat the time it adds in reading, checking, and dealing with what it produces.
A report with everything in it still has to be read. If the output sits on top of the existing process instead of replacing part of it, the analyst has more work than before - and the tool sits idle. It passes the demo, everyone agrees it’s impressive, and three weeks later nobody has opened it. Surfacing too much does the same thing: a digest that flags forty items stops getting read by week three.
So ask two questions. Before you build or buy: after this exists, does the person do less total work, or more? And a month into any pilot: what did you stop doing because of it? If the answer is nothing, it isn’t saving time yet.
Librarian, not analyst
Research teams will use AI to gather and organize information. They won’t use it to form judgments for them, and I think they’re right about that.
Analysts don’t want a model shaping their view before they’ve formed their own, even when the model happens to be right. The independent view is what the firm gets paid for. Models handle the facts - company history, competitive landscape, what management has said and done over time. People handle the analysis and the forecasting.
One thing follows from that: start from the analyst’s own notes or draft instead of a blank page. You keep their voice and their framing, and the tool fills in what they missed. And when a tool does get rejected, check whether it crossed into judgment before assuming the team doesn’t get it.
Automate where the gathering is expensive and the assembly is cheap
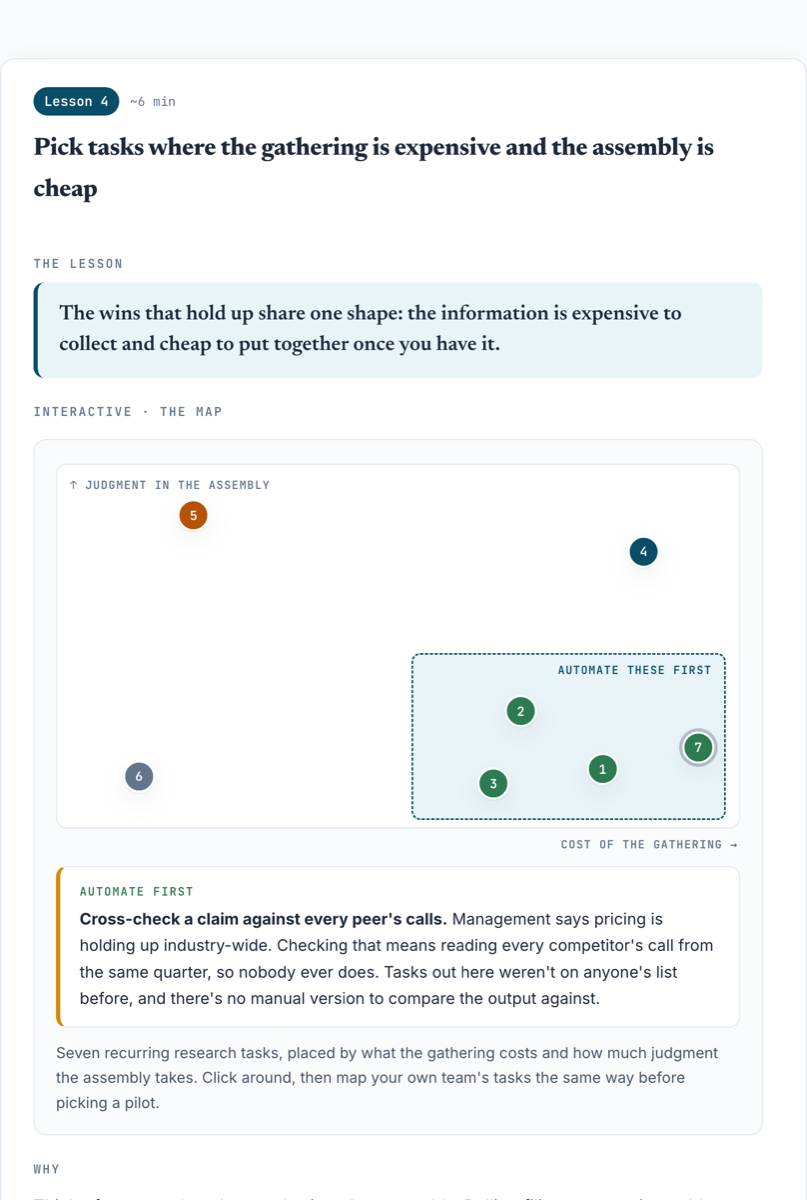
Think of a research task as gathering plus assembly. Pulling filings, transcripts, old notes, and comparables into one place is what these tools are good at, and it’s often the bulk of the hours. Which of your team’s recurring tasks are an hour of collecting and fifteen minutes of putting it together? Automate those first.
The ratio also tells you what to skip. Ten minutes of collecting and an hour of thinking doesn’t leave much for these tools to take off your plate. Teams instinctively want to start with the painful thinking-heavy tasks. Don’t.
The best candidates sit at the far end - checks so gathering-heavy that nobody would do them by hand. Take one claim from an earnings call, say that pricing is holding up across the industry, and check it against what every competitor said that quarter. Or diff this year’s 10-K against last year’s, footnote by footnote, and flag what quietly changed. These weren’t realistic before, and there’s no manual version to compare against, so you’re adding coverage instead of speeding something up.
That’s also the version I’d take to leadership. If early-stage research takes half the time, those hours go to looking at more names.
Juniors and seniors have opposite problems
Junior analysts still need to build pattern recognition by reading filings themselves, and a tool that does the reading for them takes away the reps that build it. Seniors have the opposite issue - they evaluate every new tool through decades of existing workflow, so it has to be clearly better than what they already do to earn a slot.
Teams also split into two working styles. Some people form their own view first and use AI to check it afterward. Others work with it from the start. Those habits show up early and they don’t really change, so build tools either group can use their own way.
The cheapest thing you can do is add one standing question to the weekly meeting: what’s the most useful thing you got AI to do this week? That’s how you find the people already doing it, and they’re who should teach the next session.
“How would we know if it got worse?”
Good output today doesn’t tell you much about three months from now. Providers ship updates that change model behavior, sometimes without a version bump, and a workflow you depend on can degrade without anything visibly breaking. These are non-deterministic machines, and for anyone who has run production systems that’s a legitimate concern.
So set up a standing check. Keep a fixed set of tasks where you already know what a good answer looks like, and re-run them on a schedule and after every change to the model, the vendor, or the prompts. The easiest place to get that set is work the team has already done, where the answers are settled. For a research workflow that might be questions about past quarters that everyone on the desk would answer the same way.
Scoring depends on the task. Where there’s a clear right answer, code can check it. Where the output is more of a judgment call, grade it against a written standard, either with a second model or with a person going through a handful of outputs every Friday. Any of these work, as long as they’re on a schedule. Checking only when someone feels suspicious is how drift gets missed.
Ask your vendors the same question, and put your skeptics on it. The person most worried about drift is asking the right question, so hand them the test set.
An aside: how I built the page
A detour from the lessons. This part is about the format, not the research work.
I didn’t make slides for this talk. The whole thing is one HTML file. It opens in a browser, works on a phone, and I can email it to someone.
As a slide, the map below would be a picture I talk over, and it’s useless to anyone who wasn’t on the call. On the page you click a task and get my verdict and the reason for it. The quiz makes you sort tasks yourself before it shows you my answer. The test-set table runs and fails a question in front of you. All of that works the same whether I’m presenting it or you turned it up a month later.
How it got built:
- Start from what exists. My own notes, things I’d already published, a podcast transcript. I pointed a model at those files instead of describing them from memory.
- Write the outline as its own document. Each lesson as a claim, the reasoning, what to do about it, rough timings. Most of the thinking happened here, in a plain markdown file.
- Describe the audience and the job. Who’s in the room, how long I have, what they should walk away with.
- Let it draft the page. Content, layout, and the interactive parts in one file. Each figure started as a sentence or two from me, like “six research tasks, one at a time, reader picks hand-it-to-the-model or keep-it-with-the-person, then show my verdict and a one-line reason.”
- Red-pen it. Read the draft like an editor, say specifically what’s wrong and why, feed it back. Voice took the most rounds.
It’s about 1,500 lines of HTML and I’ve read maybe thirty of them. I couldn’t have written it by hand and didn’t need to. The work was describing what each piece should show and how someone moves through it.
Most people I talk to haven’t tried getting a model to build something like this. Next time you’d make a deck for something people are supposed to poke at on their own, ask for a page instead and see how it goes.
What it comes down to
The models are already good enough for most of what a research team needs. The work is picking the right tasks, keeping judgment with the people who get paid for it, and making the output checkable. That part doesn’t get easier when the next model ships.
So start with one named workflow instead of a firm-wide platform: reviewing earnings transcripts, prepping for a management meeting, refreshing a comp table. Have one motivated person get it working hands-on in a tool that can reach the actual files, then write down what worked so the next person doesn’t start over. And check where your data actually lives before you build anything on top of it, because no purchase fixes that part. I covered the path from one working version to something the whole firm uses in Building the Multiplayer Institutional Brain.
If you’re doing this inside a research team, I’d like to hear which of these don’t match what you’re seeing. The adoption ones are where I’d expect the most variation from one firm to the next.